Certifications in Data Literacy, Advanced Spreadsheets, Data Visualization
- Shauna Mellor
- Jun 2, 2025
- 2 min read

As a more detailed extension of my resume, I have included images of my certification completions through NCLab, showcasing the hands-on training and technical skills I’ve acquired in data literacy and spreadsheet-based data analysis.
Data Literacy

Data Import and Cleaning: Competent in importing data and preparing it for analysis through cleaning and formatting.
Data Formatting: Skilled in formatting both numerical and text data for clarity and accuracy.
Spreadsheet Efficiency: Proficient in using keyboard shortcuts and multiple worksheets to streamline data work.
Conditional Formatting: Able to highlight trends and anomalies using conditional formatting tools.
Data Analysis and Calculation: Capable of performing calculations using built-in spreadsheet functions and formulas.
Logical Functions: Experienced with Boolean logic, conditional statements, and logical operators to drive decision-making.
Text Manipulation: Knowledgeable in using text functions to parse, clean, and reformat textual data.
Data Export: Able to clean and export data for reporting or integration into other systems.
Advanced Spreadsheets
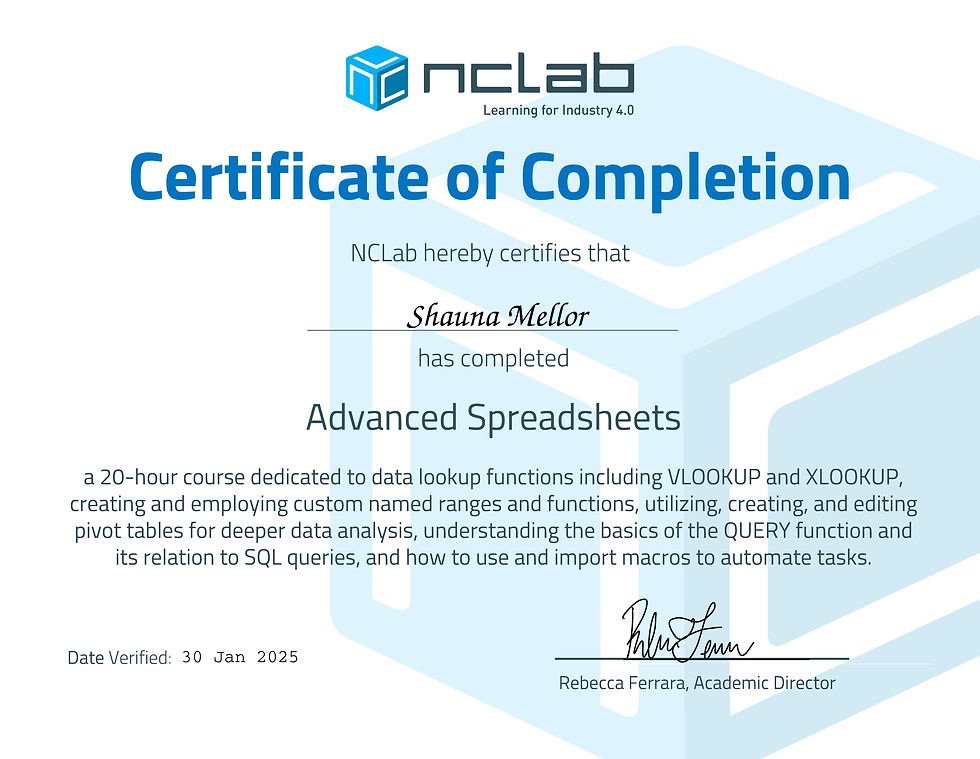
Proficient in advanced lookup functions, including VLOOKUP and XLOOKUP
Skilled in creating and using custom named ranges for more dynamic formulas
Able to develop and manage custom spreadsheet functions
Experienced in building and editing pivot tables for in-depth data analysis
Familiar with the QUERY function and its relationship to SQL syntax
Capable of automating repetitive tasks using macros
Knowledgeable in importing macros to enhance workflow efficiency
Trained in applying advanced spreadsheet techniques to clean, analyze, and present data
Data Visualization

Proficient in visualizing qualitative (categorical) and quantitative (numeric) data using spreadsheets
Skilled in creating and modifying charts (e.g., bar, line, pie, scatter plots) for effective communication
Knowledgeable in selecting the appropriate visualization method based on the type and purpose of the data
Familiar with best practices for chart design and data storytelling
Understanding of fundamental data concepts, including classifications and types of data
Awareness of data regulations, collection methods, and the potential for bias in visualization
Capable of using visualizations to highlight trends, patterns, and insights clearly and accurately

Comments